

2025 Real Estate Listings Hit Record High: January–April Data Breakdown
Published | Posted by Dan Price
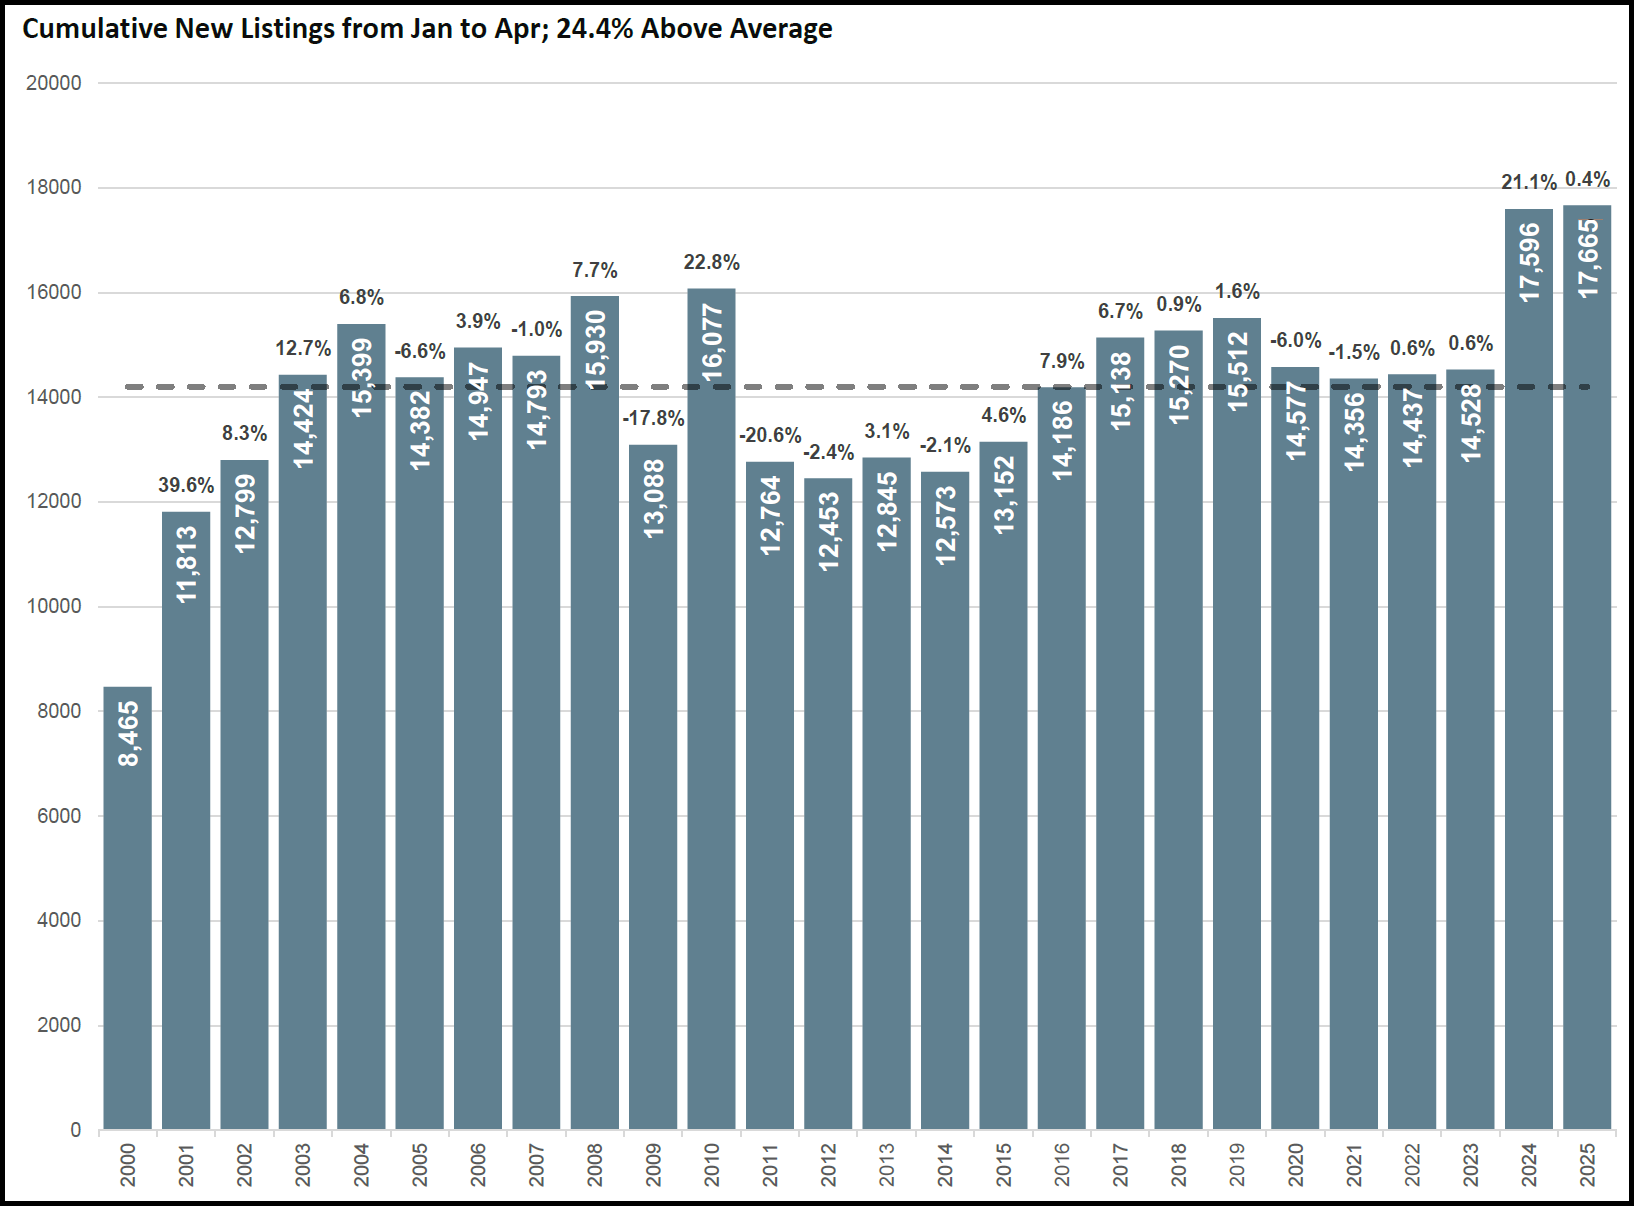
Record-High New Real Estate Listings in 2025: A Data-Driven Look at January to April Trends
In the first four months of 2025, the real estate market has seen an unprecedented surge in new listings, reaching a record high compared to the past 25 years. Data from Team Price Real Estate, revised on April 23, 2025, shows that cumulative new listings from January to April totaled 17,665, surpassing the previous high of 17,596 set in 2024. With one week remaining in April, this figure already marks a significant milestone, positioning 2025 as a standout year for real estate inventory. The data, which tracks new listings back to 2000, reveals that this year’s total is 24.4% above the historical average of 14,148, highlighting a dramatic increase in properties entering the market.
The journey to this record began in 2000, when January to April saw 8,465 new listings. Over the years, the cumulative total fluctuated, peaking at 15,399 in 2004 before dipping to lows like 12,453 in 2012 and 12,764 in 2011 during the post-2008 recovery. The market saw steady growth through the 2010s, with totals ranging from 12,573 in 2014 to 15,512 in 2019. The pandemic years brought volatility, with 14,577 listings in 2020 and a rebound to 14,356 in 2021. By 2023, the cumulative total was 14,528, but 2024 marked a significant jump to 17,596, a 21.1% increase year-over-year. In 2025, the cumulative total of 17,665 reflects a modest 0.4% increase over 2024, yet it secures the record, driven by strong performance in the early months despite a slower April.
April’s new listings provide a closer look at the 2025 trend. As of April 23, 2025, April recorded 4,494 new listings, a 16.2% decrease from April 2024’s 5,363. Historically, April listings have varied widely, from a low of 2,226 in 2000 to a high of 5,363 in 2024. Notable year-over-year changes include a 45.4% surge in 2001 (3,237 listings), a 38.6% spike in 2010 (4,880), and a 25.2% drop in 2011 (3,652). The 2024 April figure was a 28.7% increase over 2023’s 4,167, setting a high bar that 2025’s April has not matched so far. However, the cumulative total for 2025 remains unmatched, suggesting that January through March were particularly strong, pushing the year to its record-setting pace.
To understand the scale of 2025’s achievement, consider the historical average. The average cumulative new listings from 2000 to 2024, calculated across 25 years, is 14,148. This figure accounts for boom years like 2004 (15,399) and 2008 (15,930), as well as lean years like 2009 (13,088) and 2012 (12,453). The 2025 total of 17,665 is 24.4% above this average, a figure that underscores the exceptional volume of properties listed this year. Projections for the final week of April suggest even greater growth. With a daily listing rate of approximately 195 (4,494 over 23 days), the remaining seven days could add about 1,365 listings, bringing April’s total to around 5,859 and the cumulative total to approximately 19,030. This would represent an 8.2% increase over 2024’s 17,596, further solidifying 2025’s record.
The data also highlights significant year-over-year shifts in cumulative listings. For example, 2010 saw a 22.8% increase to 16,077 listings, while 2011 experienced a 20.6% decline to 12,764. More recently, 2020’s cumulative total fell 6.0% to 14,577, and 2023 remained nearly flat at 14,528, up just 0.6% from 2022’s 14,437. The 21.1% jump in 2024 to 17,596 was a major driver of the current trend, setting the stage for 2025’s 0.4% increase to 17,665. These fluctuations reflect the real estate market’s sensitivity to economic conditions, interest rates, and seasonal patterns, with 2025’s record indicating a robust supply of properties entering the market.
While the new listings data paints a picture of abundant inventory, the context of pending sales suggests a complex market. Cumulative pending sales in 2025, at 13,504 as of April 23, are down 16.3% from 2024’s 16,140, and April’s pending sales of 2,727 represent a 38.7% drop from 2024’s 4,448. This contrast highlights a market where supply is outpacing demand, but the focus here remains on the new listings, which continue to break records. The data from Team Price Real Estate, covering 2000 to 2025, provides a clear view of this historic moment, with 17,665 cumulative listings marking a high point in real estate activity.
As the final week of April 2025 unfolds, the cumulative new listings are likely to climb higher, potentially approaching 19,030. This would not only reinforce 2025’s record but also push the year further above the 24.4% historical average benchmark. The real estate market, as captured in this data, is experiencing a significant moment of growth in inventory, with 2025 standing out as a year of unprecedented new listings. Whether this trend continues into the rest of the year will depend on various factors, but the numbers from January to April tell a compelling story of a market reaching new heights.
FAQ Section
What is the trend in new real estate listings for 2025?
In 2025, cumulative new real estate listings from January to April reached 17,665 as of April 23, a record high compared to the previous peak of 17,596 in 2024. This total is 24.4% above the historical average of 14,148 (2000–2024), driven by strong January–March performance despite a 16.2% drop in April listings (4,494 vs. 5,363 in 2024). Projections suggest the cumulative total could hit 19,030 by April’s end, an 8.2% increase over 2024.
How do 2025 new listings compare to previous years?
The 2025 cumulative new listings (17,665 as of April 23) surpass all years since 2000, exceeding 2024’s 17,596, 2010’s 16,077, and 2008’s 15,930. Historical lows include 2000 (8,465) and 2012 (12,453). The 24.4% increase over the 14,148 average (2000–2024) highlights 2025’s exceptional inventory, following a 21.1% jump in 2024 from 2023’s 14,528.
What factors contribute to the increase in new real estate listings?
The data does not specify causes, but the 2025 record of 17,665 new listings (24.4% above the 14,148 average) may reflect seller confidence, pent-up supply from prior years, or increased new construction. The 21.1% surge in 2024 to 17,596 set the stage, while 2025’s 0.4% increase (projected to 8.2% by April’s end) suggests continued inventory growth.
Request Info
Have a question about this article or want to learn more?
