Austin Real Estate Weekly Market Update - December 26, 2024
by: Team Price Real Estate, Austin's leading data analysis brokerage, where data drives exceptional service
Published on: Thursday, December 26, 2024 at 7:23 am
Team Price Real Estate publishes weekly updates on Austin real estate market statistics and refreshes individual reports daily, ensuring clients have the most accurate and actionable data. This commitment to real-time insights empowers buyers, sellers, and agents to navigate the dynamic market with confidence and clarity
Updated Market Overview
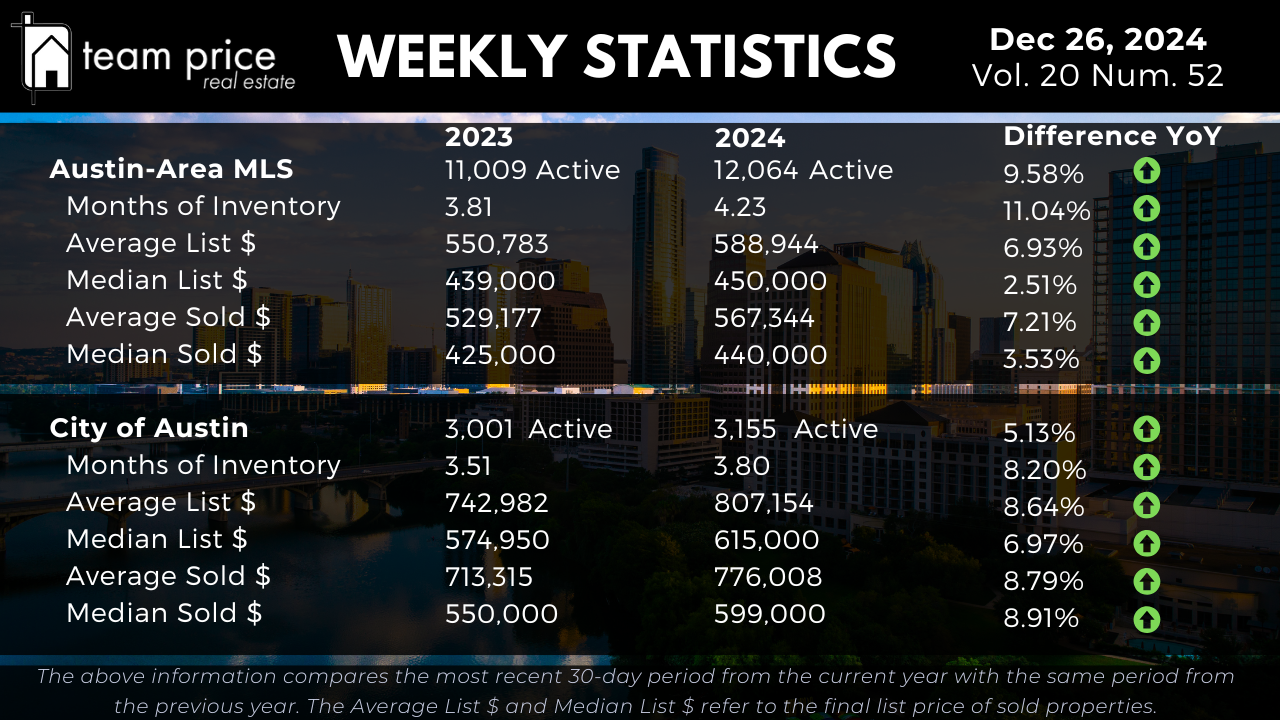
The Austin real estate market continues to evolve as we move through the end of 2024. The total number of active listings in the Austin-area MLS has increased to 12,064, reflecting a 9.58% rise compared to last year’s 11,009 active listings. Months of Inventory has grown to 4.23 months, marking an 11.04% increase from 3.81 months in 2023. This shift indicates a growing supply of homes and extended market times for properties. In the City of Austin, the number of active listings has risen to 3,155, a 5.13% increase from last year’s 3,001 listings. Months of Inventory in the city has grown to 3.80 months, up 8.20% from 3.51 months a year ago.
Pricing Dynamics in Austin Real Estate
Home prices in the Austin-area MLS have shown moderate year-over-year growth. The average list price for active homes is now $588,944, reflecting a 6.93% increase from last year’s $550,783. The median list price has climbed to $450,000, a 2.51% increase compared to $439,000 in 2023. Sold prices have also experienced growth, with the average sold price reaching $567,344, up 7.21% from $529,177 last year. The median sold price has risen to $440,000, marking a 3.53% increase from $425,000 in 2023. In the City of Austin, pricing trends have similarly risen. The average list price for active homes has grown to $807,154, an 8.64% increase compared to $742,982 last year. The median list price is now $615,000, reflecting a 6.97% rise from $574,950 in 2023. The average sold price in the city has increased by 8.79% to $776,008 compared to $713,315 a year ago. The median sold price has grown to $599,000, representing an 8.91% rise from $550,000 in 2023.
City and Regional Dynamics
Market trends across the Austin-area cities reveal a varied landscape. Among the 30 cities in the Austin-area MLS, 63% experienced month-over-month price increases, while 33% saw decreases. On a year-over-year basis, 53% of cities recorded price growth, while 47% experienced price declines. Despite these variations, all 30 cities have seen declines from their peak values over the past 12 months. When examining the 75 zip codes across the Austin area, 55% reported month-over-month price increases, while 44% experienced declines. Year-over-year, 45% of zip codes recorded price increases, while 55% saw decreases. Over the past 12 months, only one zip code has shown an increase from its peak value, while 74 have seen declines.
Sales vs. List Price Analysis
Buyer behavior in the Austin-area MLS highlights ongoing negotiations in the current market. This month, 72.09% of sold properties closed below their list price, an increase from 68.28% last month. Homes selling at their list price accounted for 17.85% of transactions, down from 21.95% last month. Meanwhile, 10.06% of sold properties closed above their list price, a slight increase from 9.77% last month. In December 2023, only 8.95% of homes sold above the list price. The average sold price to list price ratio now stands at 96.88%, reflecting cautious buyer activity.
Peak Value Analysis: Austin-Area MLS
Prices in the Austin-area MLS have decreased from their peak values over the past 12 months. The average list price peaked at $708,929 in March 2023 and has since fallen by 15.88% to $596,375. The median list price reached its highest point of $539,900 in May 2022 and has declined by 21.28% to $425,000. The average sold price peaked at $664,515 in May 2022 and has dropped 11.79% to $586,143. The median sold price has fallen 16.36% from its peak of $538,000 to $450,000. The average sold price per square foot has decreased 20.99% from $324 to $256, while the median price per square foot has dropped 21.79% from $280 to $219.
Peak Value Analysis: City of Austin
In the City of Austin, declines from peak values have been less pronounced. The average list price peaked at $945,328 in April 2024 and has since decreased by 7.24% to $876,881. The median list price peaked at $658,589 in May 2022 and has dropped by 10.07% to $592,256. The average sold price reached its peak of $847,583 in May 2022 and has fallen by 7.39% to $784,959. The median sold price has decreased 13.24% from its peak of $680,000 to $590,000. The average sold price per square foot has dropped 20.59% from $442 to $351, while the median sold price per square foot has declined by 23.41% from $393 to $303. The market continues to adjust to shifts in inventory and pricing, signaling a cautious yet stable environment as we approach the end of 2024
Closing Thoughts
The Austin real estate market is displaying steady signs of stabilization as it transitions from the rapid price surges of previous years. Increased inventory, measured price growth, and shifting buyer dynamics are fostering a more balanced market environment. These developments offer key insights for buyers and sellers navigating today’s conditions. Staying informed about the latest market trends is essential for strategic decision-making in this evolving landscape. This comprehensive report, spanning over 800 pages, provides an in-depth analysis of the Austin real estate market, focusing on critical elements such as market cycles, affordability, and interest rates. Team Price Real Estate leverages its expertise and data-driven approach to deliver unparalleled service, embodying its mission of "Where Experience Meets Insight" in the Austin real estate market.