Market Overview
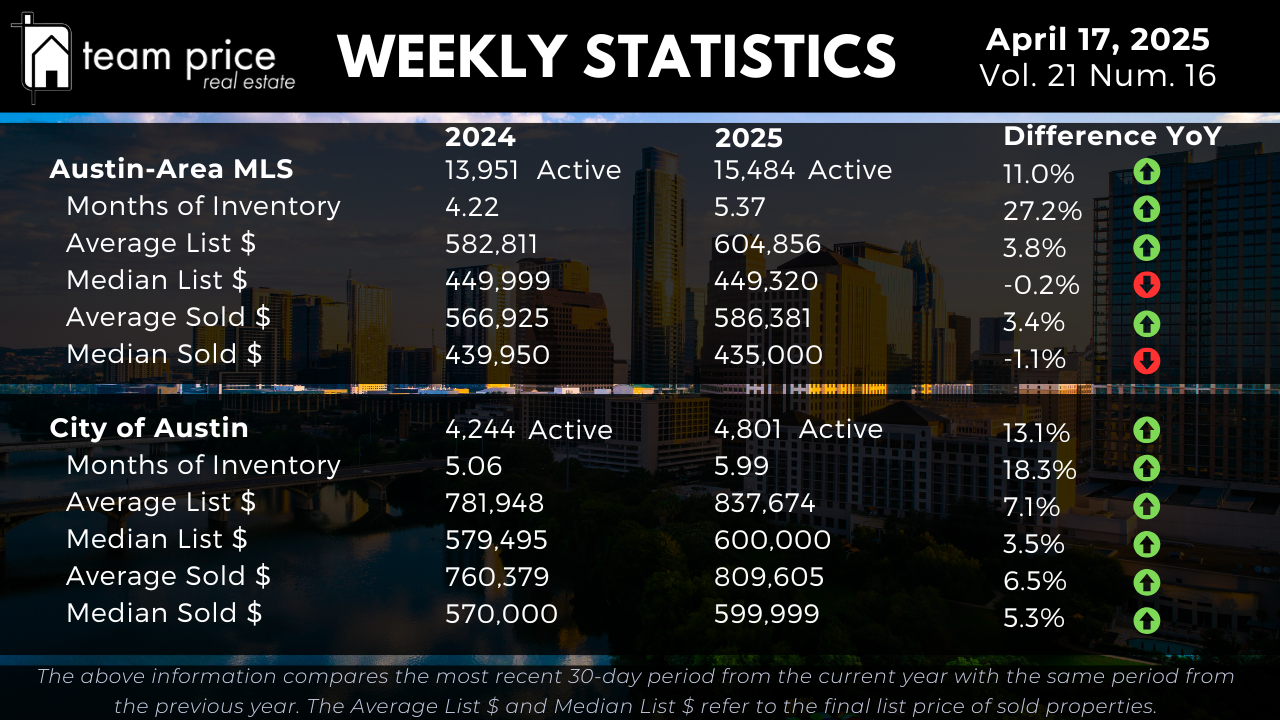
The Austin-area MLS currently lists 15,484 active properties as of April 17, 2025, up 11.0% from 13,951 in 2024. Months of Inventory has increased to 5.37 months, a 27.2% rise from 4.22 months last year, indicating a slower sales pace in the Austin real estate market. In the City of Austin, active listings grew 13.1% to 4,801 from 4,244, with Months of Inventory climbing 18.3% to 5.99 months from 5.06 months. These figures highlight the evolving inventory trends across the Austin market in 2025.
Pricing Dynamics in Austin Real Estate
Pricing in the Austin-area MLS shows varied shifts. The average active list price reached $604,856, a 3.8% increase from $582,811 in 2024. The average sold price rose 3.4% to $586,381 from $566,925. Median active list prices dropped 0.2% to $449,320 from $449,999, while median sold prices decreased 1.1% to $435,000 from $439,950. In the City of Austin, the average active list price jumped 7.1% to $837,674 from $781,948, and the median active list price rose 3.5% to $600,000 from $579,495. The average sold price increased 6.5% to $809,605 from $760,379, with the median sold price up 5.3% to $599,999 from $570,000. These metrics reflect diverse pricing shifts in the 2025 Austin real estate market.
City and Regional Dynamics
Central Texas reveals mixed trends across 30 cities. Month-over-month, 14 cities (47%) recorded price increases, while 16 (53%) saw declines. Year-over-year, 16 cities (53%) gained value, and 14 (47%) lost ground. Across 75 zip codes, 35 (47%) posted month-over-month price gains, and 38 (51%) decreased. Year-over-year, 37 zip codes (49%) are up, and 38 (51%) are down. No cities exceeded their 12-month peaks, with 30 cities and 74 of 75 zip codes below their highs, while 1 zip code has increased from its 12-month peak. These patterns provide a broader view of the Austin-area real estate landscape.
Central Texas Cities and Zip Code Analysis
In the 30 Central Texas cities tracked, 16 show year-over-year price increases, while 14 are down. Month-over-month, 14 cities rose, and 16 fell. No city hit a new 12-month peak, with 30 below their highs. Among the 75 zip codes, 37 recorded year-over-year gains, and 38 declined. Month-over-month, 35 zip codes increased, and 38 decreased. One zip code surpassed its 12-month high, with 74 remaining below peak values. This data sharpens the focus on performance trends in the Austin real estate market for 2025.
Sales vs. List Price Analysis
In the Austin real estate market this month, 64.49% of homes sold below list price, down from 66.36% last month. Approximately 22.44% sold at list price, up from 21.38%, and 13.08% sold above list price, rising from 12.26%. In March 2024, 15.29% sold above list price. The average sold-to-list price ratio is 97.77%, indicating a market where buyers retain slight negotiating power as of April 2025.
Peak Value Analysis: Austin-Area MLS
The Austin-area MLS remains below its 2022 peaks. The median list price dropped 7.4% from $539,900 in May 2022 to $499,900, a $40,000 decline. The average sold price fell 6.9% from $664,515 in May 2022 to $618,630, down $45,885. The median sold price decreased 14.5% from $538,000 to $459,990, a $78,010 drop. Price per square foot also declined, with the average down 14.8% from $324 in April 2022 to $276, and the median down 17.9% from $280 to $230. These reductions underscore a market adjusting from its earlier highs.
Peak Value Analysis: City of Austin
In the City of Austin, prices have shifted from 2022 levels. The median list price peaked at $705,000 in April 2025, matching its current value. The average sold price fell 3.3% from $847,583 in May 2022 to $819,373, down $28,210. The median sold price decreased 12.5% from $680,000 in May 2022 to $595,000, down $85,000. Price per square foot declined, with the average down 16.5% from $442 in May 2022 to $369, and the median down 18.3% from $393 in April 2022 to $230. These figures show the City of Austin market stabilizing into 2025.