Market Overview
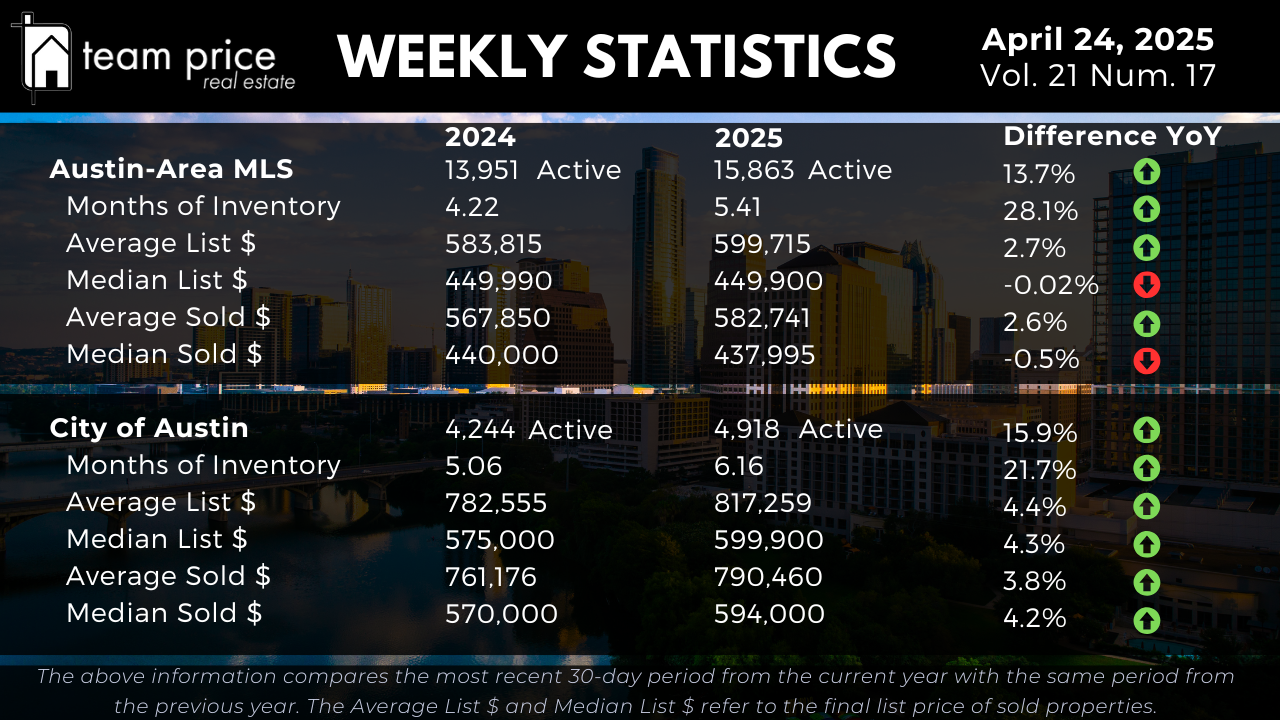
The Austin-area MLS currently lists 15,863 active properties as of April 2025, up 13.7% from 13,951 at this time last year. This growth in inventory is reflected in the Months of Inventory, which has increased 28.1% year-over-year to 5.41 months, up from 4.22 months in April 2024. This indicates a slower sales pace and a more buyer-friendly environment across the region. In the City of Austin, active listings rose 15.9% to 4,918 from 4,244, while Months of Inventory climbed 21.7% to 6.16 months from 5.06. These increases represent a 1.3x jump in the overall Austin-Area MLS and a 1.2x rise in Austin itself, underscoring a broad shift in supply trends heading deeper into 2025.
Pricing Dynamics in Austin Real Estate
The Austin-area MLS continues to show moderate pricing shifts. The average active list price rose 2.7% to $599,715 from $583,815 in 2024, while the average sold price increased 2.6% to $582,741 from $567,850. However, median figures show slight declines. The median list price dipped 0.02% year-over-year to $449,900 from $449,990, while the median sold price edged down 0.5% to $437,995 from $440,000. In the City of Austin, prices trended higher. The average active list price is now $817,259, up 4.4% from $782,555, and the median active list price increased 4.3% to $599,900 from $575,000. On the sold side, the average price rose 3.8% to $790,460, and the median sold price climbed 4.2% to $594,000 from $570,000. These figures highlight divergent pricing behavior, with regional flattening and modest gains in core Austin.
City and Regional Dynamics
Across the 30 Central Texas cities monitored, market conditions are evenly split. Fifteen cities posted month-over-month price increases, while the remaining fifteen experienced declines. The year-over-year trend mirrors this balance, with 50% of cities up and 50% down. None of the cities exceeded their 12-month price peaks, and 28 cities have seen price declines from those peaks. Among the 75 zip codes tracked, 36 (48%) recorded month-over-month price increases, while 37 (49%) saw decreases. On a year-over-year basis, 33 zip codes (44%) showed price appreciation, while 41 (55%) declined. Only one zip code is currently priced above its 12-month peak, while 74 remain below. These patterns illustrate a regional market that continues to recalibrate from earlier highs.
Sales vs. List Price Analysis
In April 2025, 64.48% of homes sold below list price, down from 66.36% the month before. A slightly larger share of homes—22.58%—sold at list price, compared to 21.38% previously. Meanwhile, 12.94% of homes sold above list price, a modest increase from 12.26% last month but still below the 15.29% seen in March 2024. The average sold-to-list price ratio stands at 97.72%, suggesting that while sellers are still negotiating, buyers continue to retain some leverage in most transactions.
Peak Value Analysis: Austin-Area MLS
The Austin-area MLS remains below the peaks observed in 2022 across most pricing categories. The median list price has dropped 7.6% from its May 2022 peak of $539,900 to $499,000. The average sold price is down 9.3% from $664,515 in May 2022 to $602,561 today. Median sold prices saw an even sharper drop of 16.4%, falling from $538,000 to $450,000. Average price per square foot has decreased 16.0% from $324 in April 2022 to $272, while the median price per square foot fell 18.6% from $280 to $228. These reductions underscore an ongoing market correction from the peak pricing observed three years ago.
Peak Value Analysis: City of Austin
In the City of Austin, two price metrics have reached new highs. As of April 2025, the average list price is $1,009,201 and the median list price is $699,000—both representing new peak values. However, sold prices remain below their previous highs. The average sold price has decreased 6.1% from the May 2022 peak of $847,583 to $795,668. The median sold price is down 11.8% from $680,000 to $599,999. The average price per square foot has declined 17.6% from $442 to $364, while the median price per square foot has dropped 19.8% from $393 in April 2022 to $228. While listing prices are reaching new records, sales prices continue to reflect the adjusted conditions of the 2025 market.