Updated Market Overview
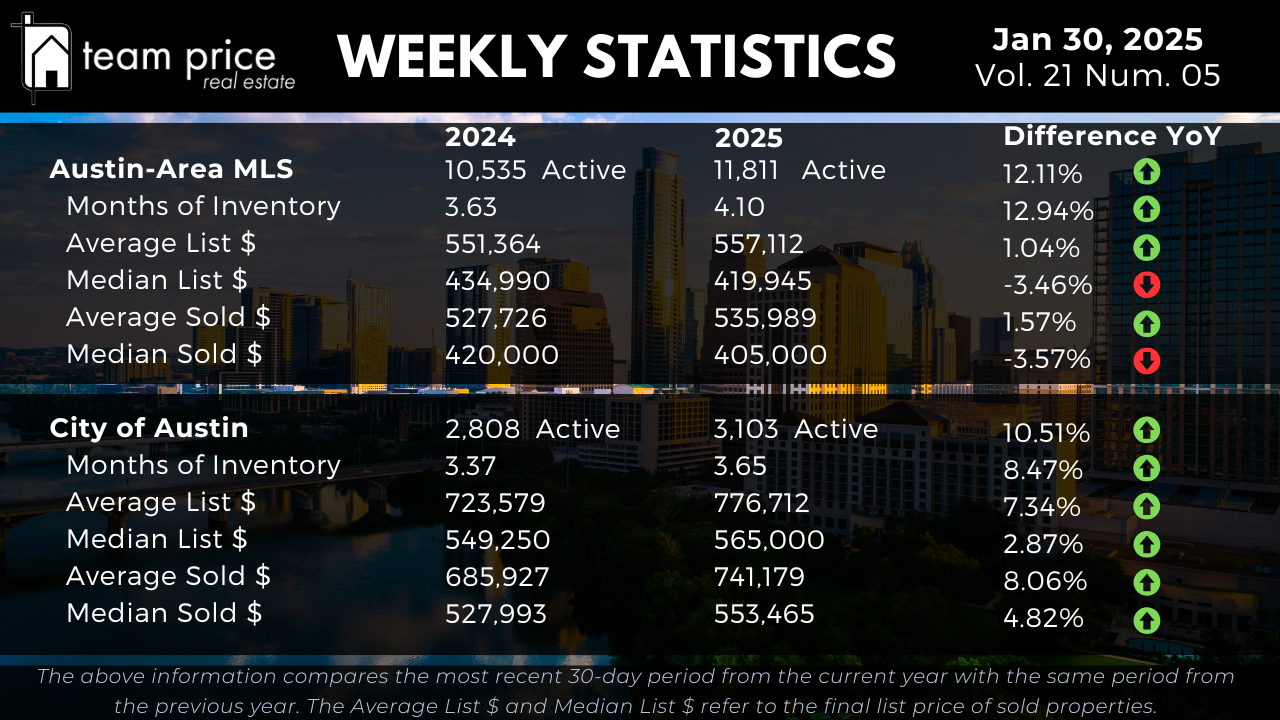
As we begin 2025, the Austin-area real estate market is experiencing increased activity. The Austin-area MLS currently holds 11,811 active listings, a 12.11% increase from last year's 10,535. The Months of Inventory has risen to 4.10 months, reflecting a 12.94% increase from 3.63 months in 2024. The City of Austin has also seen an inventory increase, with active listings rising by 10.51% from 2,808 to 3,103, and Months of Inventory increasing to 3.65 months from 3.37 months, an 8.47% rise.
Pricing Dynamics in Austin Real Estate
The pricing landscape continues to shift. The average list price for active homes in the Austin-area MLS is now $557,112, reflecting a 1.04% increase year over year. The median active list price has decreased by 3.46% to $419,945. The average sold price has risen by 1.57% to $535,989, while the median sold price has dropped by 3.57% to $405,000. In the City of Austin, the average active list price has increased by 7.34% to $776,712, with the median active list price rising by 2.87% to $565,000. The average sold price has grown by 8.06% to $741,179, while the median sold price has reached $553,465, marking a 4.82% year-over-year increase.
City and Regional Dynamics
Market performance varies across the Austin-area MLS, showing different trends among cities and zip codes. Over the past month, 33% of cities experienced price increases, while 67% saw declines. Year over year, 40% of cities recorded price gains, while 60% experienced decreases. Over the past 12 months, no cities have increased in price from their peak values, while 29 have seen a decline. Among the 75 zip codes in the region, 43% recorded month-over-month price increases, while 56% saw declines. Year-over-year, 45% of zip codes reported price gains, while 55% experienced declines. Over the past year, four zip codes have surpassed their previous peak values, while 71 remain below their peak.
Central Texas Cities and Zip Code Analysis
The market across Central Texas shows varied performance. Out of the 30 cities analyzed, 12 have recorded a year-over-year price increase, while 18 have experienced declines. On a month-over-month basis, 10 cities saw prices rise, while 20 recorded decreases. When looking at peak values over the past 12 months, no cities have increased in price, and 29 have seen a drop. Among the 75 zip codes, 34 have seen year-over-year price increases, while 41 have declined. In terms of monthly trends, 32 zip codes saw price increases, while 42 recorded declines. Over the past 12 months, only four zip codes have surpassed their peak values, while 71 remain below previous highs.
Sales vs. List Price Analysis
Negotiation remains a key factor in today’s market. This month, 69.62% of properties sold below their list price, slightly down from 71.32% last month. The proportion of properties selling at their list price has risen to 20.79%, up from 18.29%. Meanwhile, 9.59% of homes sold above their list price, a slight decrease from 10.39% last month. In January 2024, this figure stood at 9.42%. The average sold price to list price ratio is currently 96.73%.
Peak Value Analysis: Austin-Area MLS
The Austin-area MLS has seen price adjustments from previous peaks. The average list price has declined by 6.12% from its March 2023 peak. The median list price has dropped by 14.17% from May 2022. The average sold price has fallen by 19.65% from its peak in May 2022, and the median sold price has declined by 25.11% over the same period. Prices per square foot also reflect these downward trends.
Peak Value Analysis: City of Austin
In the City of Austin, price adjustments are less severe but still significant. The average list price has declined by 2.40% from its April 2024 peak. The median list price has fallen by 8.90% from May 2022. The average sold price has decreased by 13.58% from its May 2022 peak, while the median sold price has fallen by 18.61%. Price per square foot data follows a similar downward trend.
The Austin real estate market continues to adjust, balancing supply and demand through strategic pricing shifts. The evolving landscape presents both challenges and opportunities for buyers, sellers, and investors. Staying informed with our in-depth market analysis is crucial for making data-driven decisions. At Team Price Real Estate, we leverage our expertise and real-time insights to guide you through this dynamic market. Here’s to making informed choices and achieving your real estate goals in Austin, where "Experience Meets Insight" every day.