Market Overview
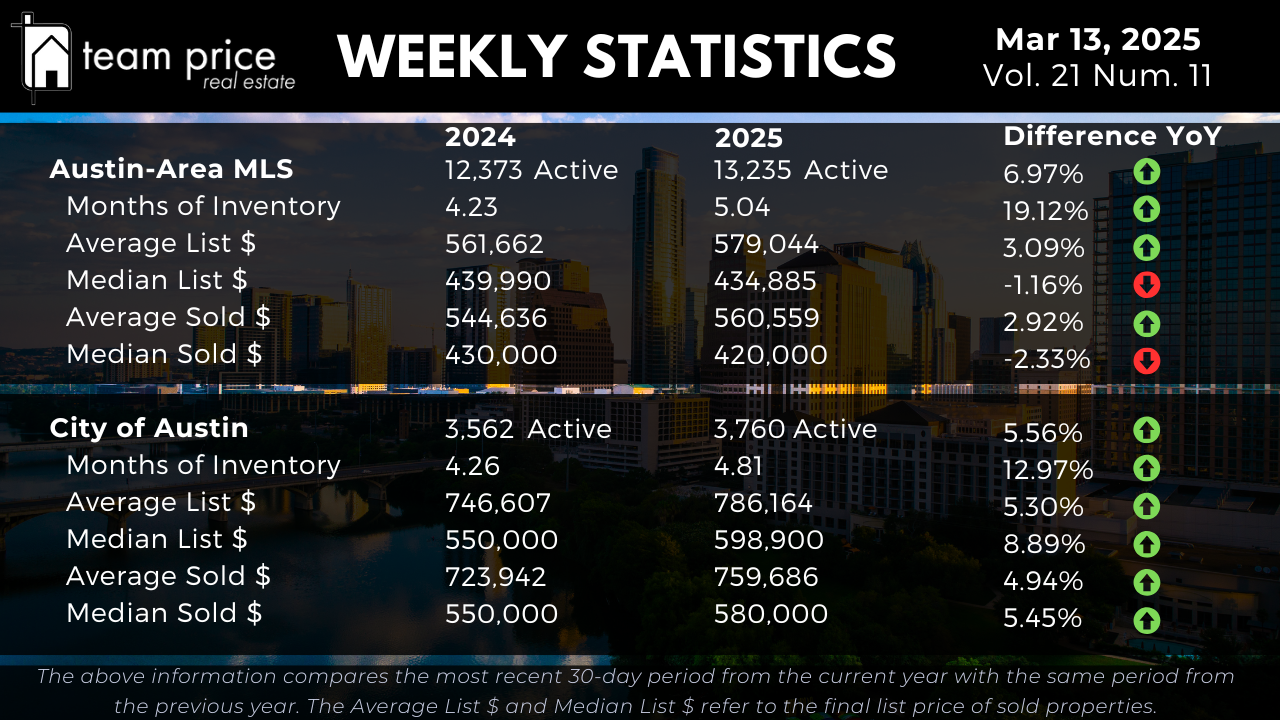
The Austin-area MLS now has 13,235 active properties as of March 13, 2025. That’s up 6.97% from 12,373 last year. Months of Inventory has climbed to 5.04 months, a 19.12% increase from 4.23 months in 2024. That shows the market is balancing out a bit more. In the City of Austin, active listings went up 5.56% to 3,760 from 3,562. Months of Inventory there rose 12.97% to 4.81 months. These changes give us a clear look at how the Austin real estate market is shifting in 2025.
Pricing Dynamics in Austin Real Estate
Pricing in the Austin-area MLS tells an interesting story. The average list price for homes is now $579,044, up 3.09% from $561,662 last year. The average sold price hit $560,559, a 2.92% jump from $544,636. But the median active list price dropped 1.16% to $434,885 from $439,990, and the median sold price fell 2.33% to $420,000 from $430,000. In the City of Austin, things look stronger. The average active list price rose 5.30% to $786,164 from $746,607. The median active price jumped 8.89% to $598,900 from $550,000. Sold prices also climbed, with the average up 4.94% to $759,686 from $723,942 and the median up 5.45% to $580,000 from $550,000. These numbers show how pricing in the 2025 Austin housing market varies by area.
City and Regional Dynamics
Across Central Texas, the market has some ups and downs. Out of 30 cities we track, 13 (43%) saw prices rise month-over-month, while 16 (53%) saw them drop. Year-over-year, 13 cities (43%) gained value, but 17 (57%) lost some. Looking at 75 zip codes, 42 (56%) had month-over-month price increases, while 30 (40%) went down. Year-over-year, 31 zip codes (41%) are up, but 44 (59%) are down. Only 3 zip codes beat their 12-month peaks, with 72 still below. No cities hit new highs in the past year. These Central Texas housing trends help us see what’s happening beyond just Austin.
Central Texas Cities and Zip Code Analysis
Let’s break it down further. In the 30 cities we follow, 13 have higher prices year-over-year, while 17 are lower. Month-over-month, 13 cities went up, but 16 went down. Over the last 12 months, no city reached a new peak. For the 75 zip codes, 31 have year-over-year gains, while 44 are down. Month-over-month, 42 zip codes increased, and 30 decreased. Just 3 zip codes topped their 12-month highs, with 72 still lagging. This data gives a solid picture of how the Austin-area market is performing in 2025.
Sales vs. List Price Analysis
This month, 65.63% of homes in the Austin real estate market sold below list price, down a bit from 66.38% last month. About 21.88% sold right at list price, up from 21.39%. And 12.50% sold above list price, slightly higher than 12.23% last month. Back in March 2024, 15.29% sold above list price, so that’s cooled off some. The average sold-to-list price ratio is 97.40%. That means buyers still have room to negotiate in today’s market.
Peak Value Analysis: Austin-Area MLS
The Austin-area MLS has come down from its 2022 highs. The median list price dropped 7.41% from $539,900 in May 2022 to $499,900, a $40,000 decrease. The average sold price fell 10.53% from $664,515 to $594,547, down $69,968. The median sold price is off 17.56% from $538,000 to $443,528, a $94,472 drop. Price per square foot also slid. The average is down 16.98% from $324 in April 2022 to $269, and the median fell 19.64% from $280 to $225. These drops show the market adjusting after the big run-up a few years back.
Peak Value Analysis: City of Austin
In the City of Austin, prices have also eased from 2022 peaks. The median list price is down 4.09% from $658,589 in May 2022 to $631,647, a $26,942 decrease. The average sold price dropped 9.84% from $847,583 to $764,170, losing $83,413. The median sold price fell 13.97% from $680,000 to $585,000, down $95,000. Price per square foot took a hit too. The average is off 18.10% from $442 in May 2022 to $362, and the median dropped 20.36% from $393 in April 2022 to $225. This shows the City of Austin market settling into 2025.
The Austin real estate market keeps changing, and new data comes out every month. Understanding these numbers helps you stay on top of it all. At Team Price Real Estate, we combine smart data analysis with years of experience to guide our clients. "Experience Meets Insight" isn’t just a phrase for us—it’s how we deliver real results. Whether you’re buying or selling, we use Central Texas housing trends to make sure you come out ahead.