Market Overview
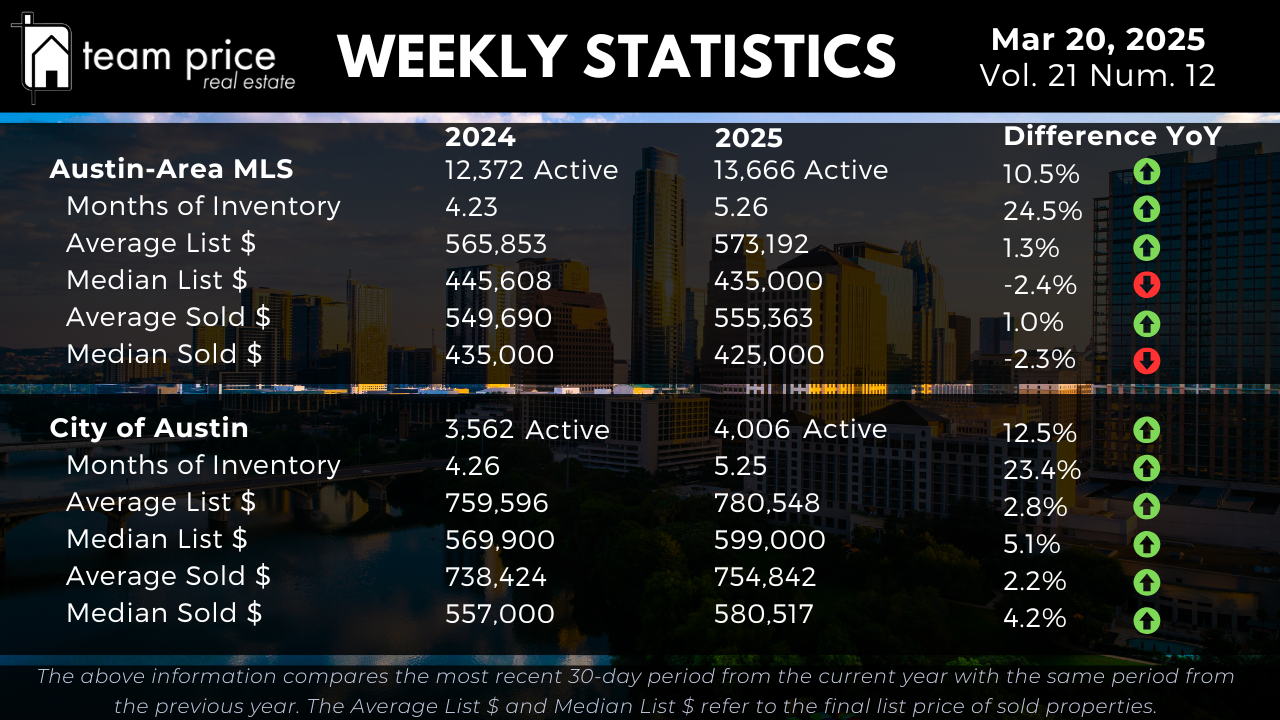
The Austin-area MLS now lists 13,666 active properties as of March 20, 2025, up 10.5% from 12,372 last year. Months of Inventory has jumped to 5.26 months, a 24.5% increase from 4.23 months in 2024, hinting at a market that’s finding more balance. In the City of Austin, active listings rose 12.5% to 4,006 from 3,562, with Months of Inventory climbing 23.4% to 5.25 months. These shifts offer a fresh snapshot of how Austin’s real estate scene is evolving in 2025.
Pricing Dynamics in Austin Real Estate
Pricing in the Austin-area MLS paints a mixed picture. The average list price for homes is now $573,192, up 1.3% from $565,853 last year. The average sold price edged up 1.0% to $555,363 from $549,690. Yet, the median active list price dipped 2.4% to $435,000 from $445,608, and the median sold price dropped 2.3% to $425,000 from $435,000. In the City of Austin, prices are trending upward. The average active list price increased 2.8% to $780,548 from $759,596, while the median active price rose 5.1% to $599,000 from $569,900. Sold prices followed suit, with the average up 2.2% to $754,842 from $738,424 and the median up 4.2% to $580,517 from $557,000. These figures highlight the diverse pricing trends across Austin’s 2025 market.
City and Regional Dynamics
Central Texas shows a varied landscape. Of the 30 cities we track, 17 (57%) saw month-over-month price increases, while 13 (43%) saw declines. Year-over-year, 16 cities (53%) gained value, but 14 (47%) lost ground. Across 75 zip codes, 49 (65%) posted month-over-month price gains, while 24 (32%) dropped. Year-over-year, 36 zip codes (48%) are up, and 39 (52%) are down. Only 3 zip codes surpassed their 12-month peaks, with 72 still below. No cities hit new highs in the past year. These trends give us a broader view of what’s happening outside Austin’s core.
Central Texas Cities and Zip Code Analysis
Diving deeper, of the 30 cities we monitor, 16 have year-over-year price increases, while 14 are down. Month-over-month, 17 cities rose, and 13 fell. No city reached a new peak in the last 12 months. For the 75 zip codes, 36 show year-over-year gains, while 39 are lower. Month-over-month, 49 zip codes went up, and 24 went down. Just 3 zip codes topped their 12-month highs, with 72 still trailing. This breakdown sharpens our understanding of the Austin-area market’s performance in 2025.
Sales vs. List Price Analysis
This month, 65.65% of homes in the Austin real estate market sold below list price, a slight dip from 66.46% last month. About 21.36% sold at list price, nearly unchanged from 21.33%, and 13.00% sold above list price, up from 12.21%. In March 2024, 15.29% sold above list price, showing a cooling trend. The average sold-to-list price ratio sits at 97.34%, suggesting buyers still have some negotiating power in today’s market.
Peak Value Analysis: Austin-Area MLS
The Austin-area MLS has softened since its 2022 highs. The median list price fell 4.6% from $539,900 in May 2022 to $514,900, a $25,000 drop. The average sold price declined 13.7% from $664,515 to $573,450, down $91,065. The median sold price is off 19.1% from $538,000 to $435,000, a $103,000 decrease. Price per square foot also slid, with the average down 19.8% from $324 in April 2022 to $260, and the median down 21.4% from $280 to $220. These declines reflect a market recalibrating after its earlier surge.
Peak Value Analysis: City of Austin
In the City of Austin, prices have also pulled back from 2022 peaks. The median list price dropped 2.9% from $658,589 in May 2022 to $639,633, a $18,956 decrease. The average sold price fell 8.7% from $847,583 to $774,051, down $73,532. The median sold price is off 13.3% from $680,000 to $589,900, a $90,100 drop. Price per square foot declined too, with the average down 18.8% from $442 in May 2022 to $359, and the median down 19.1% from $393 in April 2022 to $220. This shows the City of Austin market stabilizing into 2025.
Austin’s real estate market is a moving target, with fresh data rolling in monthly to keep us on our toes. At Team Price Real Estate, we don’t just crunch the numbers—we turn them into strategies that work for you. Pairing our deep market analysis with hands-on experience, we’re here to navigate these shifts and help you win, whether you’re buying or selling. Think of us as your edge in Central Texas real estate—where insight meets action, every step of the way.