Market Overview
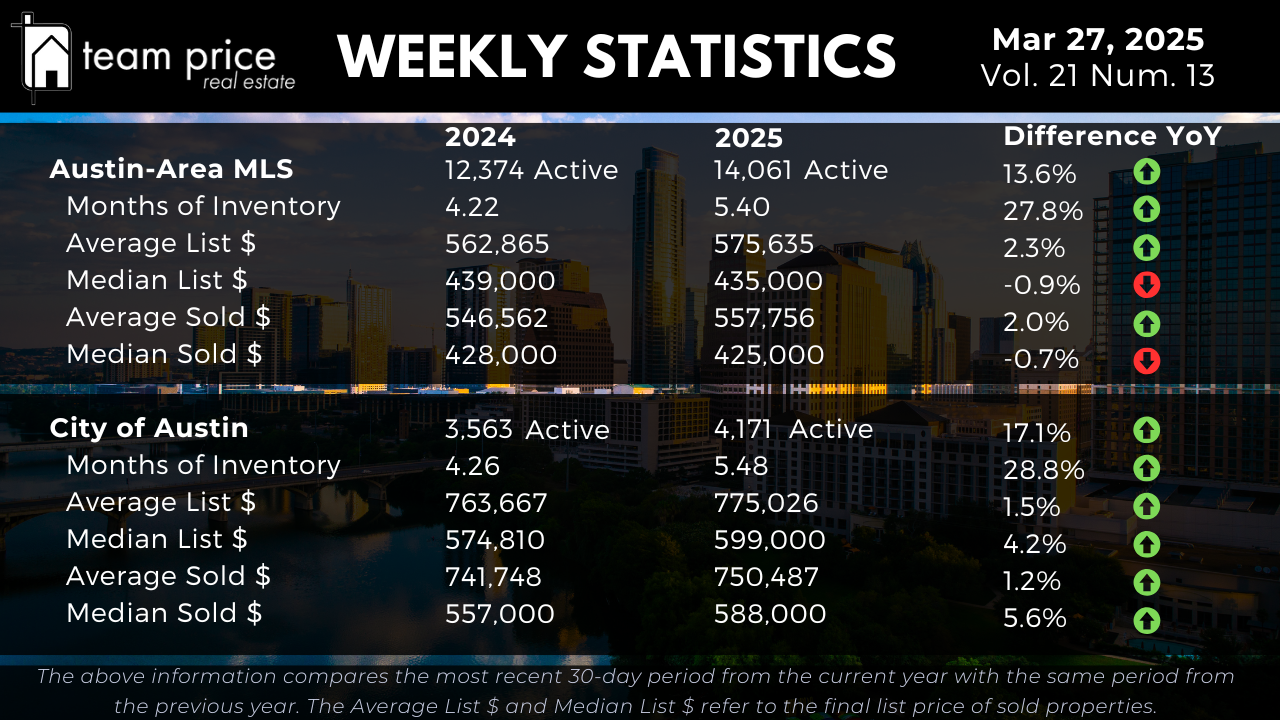
The Austin-area MLS now lists 14,061 active properties as of March 27, 2025, up 13.6% from 12,374 last year. Months of Inventory has climbed to 5.40 months, a 27.8% increase from 4.22 months in 2024, pointing to a market that’s settling into a more balanced groove. In the City of Austin, active listings jumped 17.1% to 4,171 from 3,563, with Months of Inventory rising 28.8% to 5.48 months. These shifts give us a clear look at how Austin’s real estate landscape is shaping up in 2025.
Pricing Dynamics in Austin Real Estate
Pricing in the Austin-area MLS shows a varied story. The average list price for homes is now $575,635, up 2.3% from $562,865 last year. The average sold price ticked up 2.0% to $557,756 from $546,562. But the median active list price slipped 0.9% to $435,000 from $439,000, and the median sold price dipped 0.7% to $425,000 from $428,000. In the City of Austin, prices are leaning upward. The average active list price rose 1.5% to $775,026 from $763,667, while the median active price climbed 4.2% to $599,000 from $574,810. Sold prices tracked higher too, with the average up 1.2% to $750,487 from $741,748 and the median up 5.6% to $588,000 from $557,000. These numbers spotlight the mixed pricing trends across Austin’s 2025 market.
City and Regional Dynamics
Central Texas paints a diverse picture. Of the 30 cities we track, 21 (70%) saw month-over-month price increases, while 9 (30%) saw declines. Year-over-year, 16 cities (53%) gained value, but 14 (47%) lost ground. Across 75 zip codes, 53 (71%) posted month-over-month price gains, while 22 (29%) dropped. Year-over-year, 35 zip codes (47%) are up, and 40 (53%) are down. Only 2 zip codes surpassed their 12-month peaks, with 73 still below. No cities hit new highs in the past year. These patterns offer a wider lens on what’s unfolding beyond Austin’s core.
Central Texas Cities and Zip Code Analysis
Digging deeper, of the 30 cities we monitor, 16 have year-over-year price increases, while 14 are down. Month-over-month, 21 cities rose, and 9 fell. No city reached a new peak in the last 12 months. For the 75 zip codes, 35 show year-over-year gains, while 40 are lower. Month-over-month, 53 zip codes went up, and 22 went down. Just 2 zip codes topped their 12-month highs, with 73 still lagging. This breakdown fine-tunes our grasp of the Austin-area market’s performance in 2025.
Sales vs. List Price Analysis
This month, 65.83% of homes in the Austin real estate market sold below list price, a slight drop from 66.49% last month. About 20.99% sold at list price, down a touch from 21.33%, and 13.18% sold above list price, up from 12.17%. In March 2024, 15.29% sold above list price, hinting at a cooling shift. The average sold-to-list price ratio holds steady at 97.34%, showing buyers still have a bit of room to negotiate in today’s market.
Peak Value Analysis: Austin-Area MLS
The Austin-area MLS has eased off its 2022 highs. The median list price fell 7.4% from $539,900 in May 2022 to $500,000, a $39,900 drop. The average sold price declined 13.0% from $664,515 to $578,059, down $86,456. The median sold price is off 19.1% from $538,000 to $435,000, a $103,000 decrease. Price per square foot took a hit too, with the average down 19.4% from $324 in April 2022 to $261, and the median down 21.4% from $280 to $220. These drops signal a market adjusting after its earlier climb.
Peak Value Analysis: City of Austin
In the City of Austin, prices have also softened from 2022 peaks. The median list price dropped 1.3% from $658,589 in May 2022 to $649,900, an $8,689 decrease. The average sold price fell 8.9% from $847,583 to $771,349, down $76,234. The median sold price is off 13.3% from $680,000 to $589,900, a $90,100 drop. Price per square foot slipped as well, with the average down 18.3% from $442 in May 2022 to $361, and the median down 19.8% from $393 in April 2022 to $220. This reflects the City of Austin market leveling out into 2025.
Austin’s real estate market is a moving target, with fresh data rolling in monthly to keep us on our toes. At Team Price Real Estate, we don’t just crunch the numbers—we turn them into strategies that work for you. Pairing our deep market analysis with hands-on experience, we’re here to navigate these shifts and help you win, whether you’re buying or selling. Think of us as your edge in Central Texas real estate—where insight meets action, every step of the way.